Written by: Mariana Fonseca, Editorial Team, AI Growth Agent
Key Takeaways
- AI share of voice measures how often a brand is mentioned or cited in AI answers compared to competitors.
- The metric becomes meaningful when you pair it with a labeled definition (zero-sum or non-zero-sum) and repeated sampling.
- Platforms disagree structurally because each uses different retrieval models, so brands must track and segment results by engine.
- Effective measurement tracks five dimensions: visibility, share of voice, position, citation share, and sentiment, all inside a documented dashboard schema.
- AI Growth Agent maps the full query universe, publishes authoritative content on client-owned sites, and delivers measurable lifts in AI citations, bot visits, and impressions with flat-fee pricing.
Book a Demo With AI Growth Agent
Executive Summary
AI share of voice across platforms is often reported as one number, and that number rarely survives a manual test in ChatGPT. Marketing leaders face tough questions about share of voice and need a defensible definition plus a segmentation scheme they can present to leadership. This guide serves marketing leaders at mid-market to enterprise companies who understand AI share of voice and now need cross-engine comparability and clear measurement mechanics.
The number changes based on which platforms you track, which definition you use, and how you sample prompts. SourceWatch documents that industry blogs mostly publish the zero-sum share-of-mentions formula while several shipped AI-visibility tools compute mention rate under the hood, which explains why three dashboards can report three different numbers from the same brand data. By the end of this guide, you can label your share of voice definition, calculate it with a formula, segment it by platform and prompt, handle non-determinism through repeated sampling, and hand an analyst a dashboard schema.
Book a Demo to See How AI Growth Agent Can Help
Prerequisites and Starting Conditions
This guide assumes familiarity with AI share of voice, AI visibility across platforms, prompt-based tracking, and basic analytics reporting. Before building a measurement system, you need these inputs:
- A defined competitor set of three to six direct competitors
- A seed term list covering head terms and long-tail queries
- Access to the platforms being tracked: ChatGPT, Google AI Overviews, Google AI Mode, Perplexity, Gemini, Copilot, and Claude
- A storage location for repeated samples, either a database or structured spreadsheet
Organizational factors matter as much as tooling. Before the first prompt is run, assign an owner for the number, a person to run the sampling, and a review cadence. LSEO recommends weekly monitoring for operating teams and monthly reporting for executive trend analysis, with the prompt set, competitor set, engines, and methodology held constant across periods.
See How AI Growth Agent Structures Measurement
Process Overview
The measurement process runs in five phases, each informing the next:
- Choose the definition of AI share of voice and label it.
- Select the platforms to track and understand why they disagree.
- Calculate AI share of voice with a labeled formula.
- Segment by platform, country, prompt intent, competitor, and time.
- Build the dashboard and set the review cadence.
The most common delays appear in phase one and phase three. Prompt sampling requires repeated runs because SparkToro found that the same AI query changes roughly 70% of the time, and platform answers change between runs. A measurement built on a single run is not a measurement. It is a snapshot of one draw from a distribution. With that sampling principle established, the first phase is choosing and labeling your definition of AI share of voice.
Step 1: Define AI Share of Voice and Label the Definition
The definitional gap sits at the center of every measurement problem in this category. Vendors use two incompatible definitions, and vendor numbers are not comparable unless the definition is labeled. Digital Applied identifies three competing AI share of voice formulas that produce different scores from the same data, with a worked example showing the same brand scoring 20% on mention-based share of voice, 16.8% on position-weighted share of voice, and 31.4% on citation-based share of voice from identical underlying data.
The two definitions below produce incompatible numbers from the same data, so labeling which one you use is essential. The table shows how each is calculated and when to apply it:
| Definition | Formula | What It Measures | When to Use |
|---|---|---|---|
| Zero-sum share of competitor mentions | (Your brand mentions ÷ Total brand plus competitor mentions) × 100 | Competitive share of the conversation | Competitive benchmarking against a fixed competitor set |
| Non-zero-sum mention rate | (Responses mentioning your brand ÷ Total responses) × 100 | Absolute visibility regardless of competitors | Tracking whether you appear at all |
5WPR distinguishes AI share of voice as a zero-sum competitive-share metric from AI Visibility Rate, which it defines as the percentage of total AI responses where a brand is mentioned at least once. HubSpot’s AI share of voice formula uses total AI responses for the prompt set as the denominator, which differs from competitive-share definitions that divide by total competitor mentions. These two definitions produce incompatible numbers for the same brand and prompt set. Label which one you are using before reporting any figure.
Step 2: Select the Platforms to Track
The platforms to track for AI share of voice are ChatGPT, Google AI Overviews, Google AI Mode, Perplexity, Gemini, Copilot, and Claude. Each uses a different retrieval model, which is why a brand can hold strong share on one platform and be invisible on another. The table below maps each platform’s retrieval model to the metrics you should track on it:
| Platform | Retrieval Model | What to Measure |
|---|---|---|
| ChatGPT | Training data plus Bing index via OAI-SearchBot | Mention rate, citation rate, position in answer |
| Google AI Overviews | Google Search index | Citation share, AI Overview trigger rate, position |
| Google AI Mode | Google Search index with query fan-out | Citation share, mention rate, position |
| Perplexity | Real-time crawl with numbered citations | Citation rate, source position, mention rate |
| Gemini | Google Search index plus Knowledge Graph | Mention rate, citation rate, entity recognition |
| Copilot | Bing index plus Satori knowledge graph | Citation rate, mention rate, position |
| Claude | Training data with optional web search | Mention rate, citation rate when web search enabled |
For more on how these platforms differ in practice, see How to Measure AI Share of Voice Across AI Platforms and What Is AI Share of Voice? Definition and How It Works.
See How AI Growth Agent Measures Share of Voice
Step 3: Understand Why AI Share of Voice Differs by Platform
Now that you know which platforms to track, the next step is understanding why they disagree. Citation overlap between platforms is structurally low. ZipTie’s cross-platform analysis found that only 11% of domains are cited by both ChatGPT and Perplexity for the same query, and 71% of all cited sources appear on just one AI platform. Even within Google’s own product line, AI Overviews and AI Mode cite the same URLs only 13.7% of the time.
The mechanism behind this divergence is retrieval architecture. ChatGPT sources information from its own crawler plus the Bing index, while Perplexity works primarily from its own PerplexityBot crawler. Digital Strategy Force places the major engines on a three-model sourcing spectrum: real-time crawl (Perplexity), index-plus-graph (ChatGPT, Copilot, AI Overviews, AI Mode, Gemini), and parametric-first (Claude), and states these three sourcing models barely overlap. A brand that earns citations on one engine can be invisible on the next. Optimizing for a single surface while assuming the rest follow is the most common and most expensive mistake brands make.
A Writesonic study analyzing 161,286 prompts found that any two engines share roughly 17% of their cited sources for the same prompt, with pairwise Jaccard similarity scores ranging from 0.119 to 0.237. A single blended share of voice figure hides the platform where a brand is invisible and the competitor who is gaining.
Step 4: How to Calculate AI Share of Voice
Two labeled formulas cover the primary use cases. Use the zero-sum formula for competitive benchmarking and the non-zero-sum formula for tracking absolute visibility.
Zero-Sum Share of Competitor Mentions Formula:
AI Share of Voice = (Your brand mentions ÷ Total brand plus competitor mentions) × 100
Non-Zero-Sum Mention Rate Formula:
Mention Rate = (Responses mentioning your brand ÷ Total responses) × 100
Worked example: Your brand is mentioned 45 times across 200 responses. Your three tracked competitors are mentioned 55, 60, and 40 times respectively. Your zero-sum AI share of voice is 45 ÷ (45 + 55 + 60 + 40) × 100 = 22.5%. Your non-zero-sum mention rate is 45 ÷ 200 × 100 = 22.5% only if every response mentions exactly one brand. In practice the two numbers diverge because multiple brands can appear in a single response.
Screpy distinguishes AI share of voice from answer appearance rate, which is not relative to competitors and is calculated as responses that mention your brand divided by total responses tested. Reporting both figures side by side, with their definitions labeled, is the only way to defend either number in a leadership meeting.
For additional benchmarks and context on what these numbers mean in practice, see AI Share of Voice Benchmarks: What Good Looks Like.
Step 5: Track the Five Dimensions of AI Share of Voice
Share of voice alone does not give a complete picture. A complete measurement system tracks five dimensions, each answering a different question about your brand’s presence. The table below defines each dimension and explains why it matters:
| Dimension | Definition | Why It Matters |
|---|---|---|
| Visibility | Percentage of prompts where the brand appears at all | Baseline presence |
| Share of Voice | Brand mentions as a percentage of total brand plus competitor mentions | Competitive position |
| Position | Where the brand appears in the answer (first, second, later) | Order of mention is the new ranking |
| Citation Share | Percentage of cited sources pointing to brand-owned properties | Source authority and referral potential |
| Sentiment | How the brand is framed (positive, neutral, negative, comparative) | A high share with negative sentiment signals a reputation problem |
5WPR argues that a brand can lead one AI visibility metric while trailing another, so combining AI share of voice, citation share, and AI visibility rate into a single catch-all score hides actionable insights. VisibilityStack’s sentiment analysis metric scores how positively, neutrally, or negatively a brand is framed in AI-generated answers, tracking stance rather than just emotional tone, and segmenting by platform and prompt type. A brand mentioned in 40% of responses with half of those mentions negative has a far lower effective share of voice than 40%.
Talk With AI Growth Agent About Multi-Dimensional Tracking
Step 6: Segment and Handle Non-Determinism
The segmentation scheme is platform × country × prompt intent × competitor × time. Each dimension can move independently. A brand gaining share on Perplexity while losing it on ChatGPT needs a platform-specific diagnosis, not a blended response.
Non-determinism is a first-class measurement problem. The same prompt returns different answers across runs because LLM output variation comes from deliberate sampling randomness and non-deliberate hardware-level variation that no API parameter can switch off. As noted earlier, the same AI query changes roughly 70% of the time. In identical back-to-back runs, the top recommended brand changed 44% of the time on Gemini, 43% on Perplexity, 35% on ChatGPT, and 28% on Claude. A single manual check tells you almost nothing.
The recommended approach is to run each prompt three to five times per platform and average results. Indeed Engineering recommends running each input three to five times to narrow confidence intervals and reduce measurement noise, and notes that the contribution of additional runs per input is capped at a floor while the contribution of additional unique inputs is uncapped. This means expanding the prompt set produces more signal than running the same prompts more times beyond five.
Explorium recommends repeating each prompt three to five times per platform to smooth LLM response variability caused by temperature settings, and logging the prompt text, platform, run number, and every brand named in each response. A movement is signal when it persists across multiple sampling windows. It is noise when it appears in one window and reverses in the next.
Step 7: Build the Dashboard Schema
With your segmentation scheme and sampling approach defined, the final step is to build a dashboard that captures all of it. The following schema is a build spec an analyst can implement directly. It lists every field required for the dashboard to produce defensible numbers, along with the data type and a description of what to log:
| Field | Type | Description |
|---|---|---|
| run_date | Date | Date the prompt was run |
| prompt_id | String | Unique identifier for the prompt |
| prompt_text | String | Exact prompt text |
| platform | String | ChatGPT, Perplexity, Gemini, Copilot, Claude, Google AI Overviews, Google AI Mode |
| country | String | Country code for the run |
| prompt_intent | String | Category, comparison, alternatives, use-case, recommendation |
| brand_mentioned | Boolean | Whether the brand appeared in the answer |
| brand_position | Integer | Position of the brand in the answer (1 = first) |
| competitor_mentions | JSON | Array of competitor names and their positions |
| citation_present | Boolean | Whether a URL was cited |
| citation_url | String | The cited URL if present |
| sentiment | String | Positive, neutral, negative, comparative |
| run_number | Integer | Which run of this prompt (1–5) |
Refresh Cadence: Weekly for operating teams, monthly for executive reporting.
Flagging Real Movement vs. Noise: A movement is real when it persists across three consecutive sampling windows and exceeds the confidence interval established during baseline. It is noise when it appears in one window and reverses in the next. OtterlyAI recommends using brand coverage as the top-line KPI for AI visibility and citations as the diagnostic layer underneath it, and advises building your own baseline per engine and category rather than treating published figures as universal benchmarks.
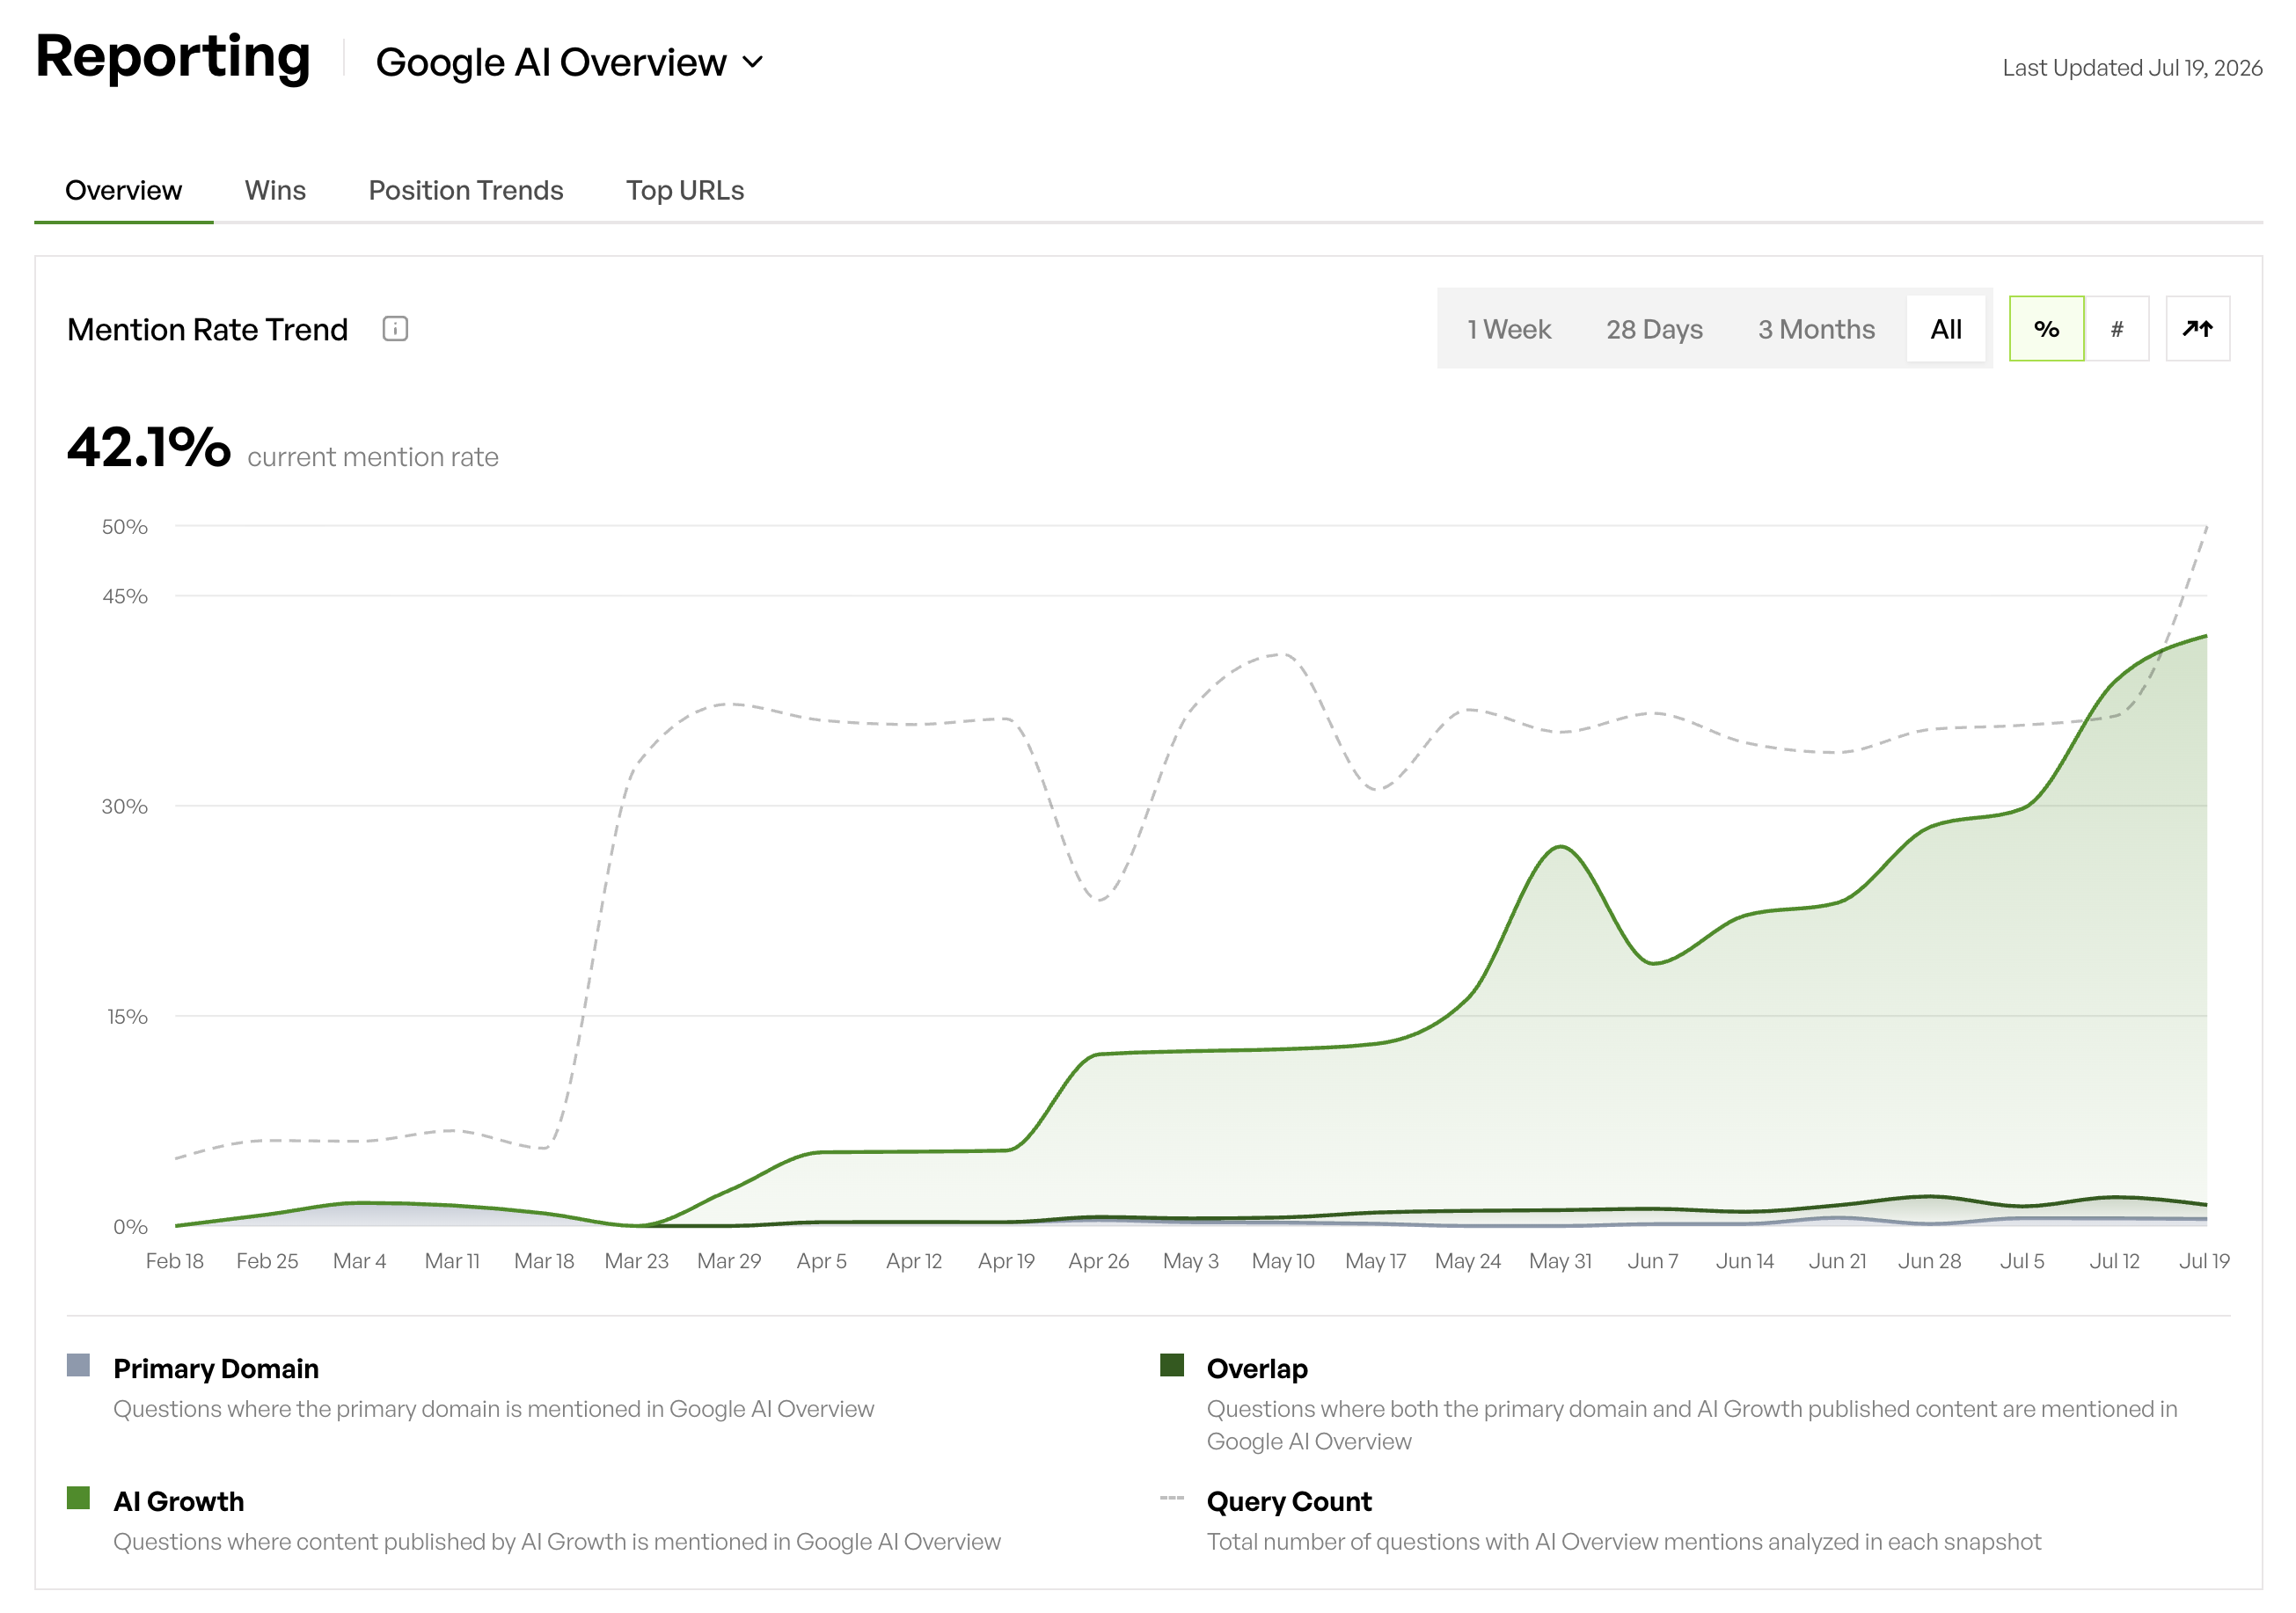
In addition to building your own dashboard, you can supplement it with first-party data sources. Google has added a native AI share of voice measurement surface inside Merchant Center. Google Merchant Center’s AI performance insights report calculates share of voice as a brand’s AI impressions divided by total impressions across the brand and its competitors, covering AI Mode, AI Overviews, and the Gemini app. Google announced that AI performance insights in Merchant Center is now generally available to businesses in Australia, Canada, India, New Zealand, and the US. This is a useful first-party data source for retail brands, but it covers only Google’s surfaces and uses a competitor set defined by Merchant Center rather than one the analyst controls.
Explore Dashboard Options With AI Growth Agent
Common Mistakes and Troubleshooting
The most common measurement failures are structural, not technical. They appear before the first prompt is run.
Common Mistakes:
- Reporting one blended share of voice number across all platforms.
- Comparing a zero-sum number to a mention rate without labeling either.
- Treating a single prompt run as a measurement.
- Ignoring sentiment alongside mention count.
- Tracking a small handful of prompts and calling it the market.
How to Troubleshoot:
- Re-check the definition label before comparing any two numbers.
- Re-run the sample before concluding the number moved.
- Check whether the platform changed its retrieval behavior.
- Revisit the segmentation before concluding the number moved at the category level.
Before a share of voice report goes to leadership, validate it against this checklist:
| Check | Pass Condition |
|---|---|
| Definition labeled | Zero-sum or non-zero-sum is stated explicitly |
| Prompt set documented | Exact prompts, version, and date range are recorded |
| Competitor set fixed | Same competitors in denominator across all periods |
| Repeated sampling | Each prompt run three to five times per platform |
| Platform segmentation | Numbers reported per platform before any blending |
| Sentiment logged | Positive, neutral, negative, or comparative recorded per run |
| Movement threshold applied | Change flagged only if it persists across three sampling windows |
Verifying Outcomes and Measuring Results
A sound measurement is confirmed by consistent definition labels, repeated samples, documented prompt sets, and a dashboard that separates platforms. The metrics to track alongside share of voice are visibility, position, citation share, sentiment, bot traffic, and Google Search Console impressions.
AI answers have no static ordered list, so order of mention and citation context become the new ranking. The recommended scoring for AI visibility tracks four weighted levels: mention (1x), citation with source link (2x), recommendation as a top option (3x), and source absorption where the brand’s evidence shapes the answer (4x). The mention level alone constitutes share of voice. The weighted roll-up constitutes a composite AI visibility score.
Review cadence: weekly for operating teams spotting movement, monthly for executive trend analysis, quarterly for strategic reviews that assess whether the prompt universe needs to expand. Cited domain sets drift 40 to 60% month over month in active categories, making a single point-in-time snapshot unreliable by construction.
Review Your Current Measurement With AI Growth Agent
Advanced Scenarios and Next Steps
Once your measurement system is running and verified, you may encounter scenarios that require adjustments to the framework. Multi-brand portfolios require a separate measurement universe per brand. Running a single blended prompt set across a portfolio produces numbers that are defensible for none of the brands in it. Each brand needs its own competitor set, its own prompt library, and its own dashboard rows.
Multiple countries require separate runs per market. A GeekyTech study found no keyword out of 613 produced a near-identical ChatGPT or Gemini answer in both the US and UK, with 99% of ChatGPT answers and 100% of Gemini answers mostly rewritten between countries. Country is not a filter to apply after the fact. It is a dimension to build into the schema from the start.
Large prompt universes require tooling. At a scale of 100 prompts times five runs times four platforms, a spreadsheet becomes unmanageable. Explorium notes that at 2,000 rows, a database or purpose-built tool is required.
As an account matures and wins more AI overviews, the universe of queries naturally grows. The measurement has to grow with it. Adjacent topics worth exploring next include citation context, the four pillars of AI search intelligence, and how living, self-healing content keeps the number from decaying as the world changes.
How AI Growth Agent Supports This Measurement Framework
The measurement framework in this guide requires tooling that can handle large prompt universes, repeated sampling, and cross-platform segmentation. AI Growth Agent fits into that workflow as the execution and growth layer on top of your measurement.
Monitoring-first tools track a metered set of prompts and hand the work back to a human through draft agents and to-do lists. AI Growth Agent takes a different approach. It maps the full universe, from hundreds to thousands of queries per client refreshed every week. It then produces authoritative content, publishes it on a site the client owns, self-heals what is live, and reports incremental visibility week over week.
Prompt count is never a billed metric, and pricing is a flat fee with no per-article charges, credit limits, or per-prompt billing. The engine maps out its own destiny. It uses data to calculate its next best action and operates on a long horizon without requiring a human to drive every step.
Across the first twelve weeks, clients average more than 12,000 additional AI citations and mentions, over 100,000 additional bot visits, and a 20% or greater lift in impressions. The first article is typically live within a week of kickoff, with content indexing in as little as ten days. AI Growth Agent is a natural consideration when evaluating options for AI visibility measurement and growth.
Frequently Asked Questions
What Are the Major AI Platforms to Track for Share of Voice?
The platforms that matter for AI share of voice measurement are ChatGPT, Google AI Overviews, Google AI Mode, Perplexity, Gemini, Microsoft Copilot, and Claude. Each uses a different retrieval architecture, which means a brand’s share of voice can differ substantially across them for the same set of prompts. Tracking fewer than three platforms produces an incomplete picture. For most B2B brands, starting with ChatGPT and Perplexity before adding Google AI Mode and AI Overviews is a practical sequence.
Why Does AI Share of Voice Differ by Platform?
Each platform uses a different retrieval model. ChatGPT draws on its training data and the Bing index. Perplexity uses its own real-time crawler. Google AI Overviews and AI Mode share retrieval infrastructure but cite different sources for the same queries. Claude operates primarily from training data with optional web search. Because the source pools barely overlap, a brand that earns citations on one engine can be invisible on another for the same prompt. This reflects a structural property of how these systems are built.
How Do You Calculate AI Share of Voice?
The formulas are the same as in Step 4: zero-sum AI share of voice and non-zero-sum mention rate. The two formulas produce different numbers from the same data. Label which one you are using before reporting any figure, and avoid comparing a zero-sum number to a mention rate without noting the difference.
What Is the Difference Between AI Share of Voice and Mention Rate?
AI share of voice is a competitive metric. It measures a brand’s mentions as a proportion of all brand mentions in the same answers, across a defined competitor set. Mention rate is an absolute metric. It measures how often the brand appears at all, regardless of what competitors are doing. A brand can hold a steady mention rate while its share of voice falls because a competitor is named more often in the same responses. Both metrics are useful, but they answer different questions and should be reported separately.
How Do You Handle Non-Determinism in AI Answers?
Non-determinism means the same prompt returns different answers across runs. This is expected behavior, not a malfunction. As recommended earlier, run each prompt three to five times per platform and average the results. A single run is a snapshot of one draw from a distribution. A movement is real when it persists across three consecutive sampling windows and exceeds the confidence interval established during baseline. It is noise when it appears in one window and reverses in the next.
How Often Should AI Share of Voice Be Measured?
Operating teams should run weekly sampling to spot movement. Executive reporting should use monthly trend data. Quarterly strategic reviews should assess whether the prompt universe needs to expand and whether the competitor set still reflects the actual market. Trigger-based runs within 48 hours of a major competitor announcement, press mention surge, or significant product launch are also warranted, since these events can shift AI share of voice materially within days.
Who Should Own the Number Internally?
The CMO or the person who controls the marketing outcome should own the number and be accountable for its definition. An analyst or marketing operations team member should run the sampling and maintain the dashboard. The definition, the prompt set, the competitor set, and the scoring rules must be documented and version-controlled so the number can be reproduced and defended. If no one owns the definition, the number will drift every time someone runs a new tool.
How Do You Segment AI Share of Voice by Platform, Prompt, and Competitor?
The segmentation scheme is platform times country times prompt intent times competitor times time. Report each platform separately before any blending. Segment prompts by intent: category, comparison, alternatives, use-case, and recommendation. Track each competitor individually in the denominator rather than grouping them. Time segmentation should use consistent windows, weekly for operating teams and monthly for executives, so period-over-period comparisons are valid. A blended number across all platforms and all intents hides the platform where a brand is invisible and the prompt cluster where a competitor is gaining.
What Is the 30% Rule for AI and Is It a Real Benchmark?
The 30% rule does not represent a standard AI share of voice benchmark. It is a heuristic that circulates in marketing discussions without a documented methodological basis. AI share of voice benchmarks vary by category size, competitor set, prompt set, engines, geography, and scoring methodology. A 30% share might lead a fragmented category with ten active brands but trail badly in a category dominated by two players. The most useful benchmark is a brand’s own trend against a stable measurement universe and the specific competitors that matter to its buyers.