Written by: Mariana Fonseca, Editorial Team, AI Growth Agent
Key Takeaways
- AI share of voice shows how often and how prominently your brand appears in AI-generated answers versus a defined competitor pool, calculated as (Your Brand Mentions ÷ Total Mentions Across Competitor Pool) × 100.
- Build a defensible prompt universe by clustering queries across eight intent types (category, problem, comparison, use case, commercial, recommendation, competitor, brand), then run them across multiple engines with repeated tests to handle variance.
- Use the competitor x topic matrix to see which clusters competitors dominate, then tie gaps to specific third-party sources such as Reddit, YouTube, and review platforms.
- Turn the diagnosis into a content plan by creating comparison and recommendation content for losing clusters, backed by validated primary sources, then re-measure to confirm the gap closed.
- AI Growth Agent maps a wide universe of seed terms and long-tail queries, creates authoritative content for each gap, publishes to a site the client owns, and updates that content over time so the gap stays closed.
See How AI Growth Agent Closes Your Visibility Gap
How To Run A 10-Step AI Share Of Voice Competitive Analysis
This 10-step sequence walks from raw prompts to a clear content plan. Each step builds on the one before it.
- Define the competitor pool from open data. Run your prompts across target engines and log every brand that surfaces to form an open, data-driven denominator. This approach avoids the distortion of a fixed competitor list that can inflate or deflate share depending on who you include.
- Build the prompt universe by intent cluster. Cluster prompts by category, problem, comparison, use case, commercial, recommendation, competitor, and brand intent. Clustering exposes gaps that a flat list hides.
- Run the prompts across multiple engines. Execute each prompt across ChatGPT, Perplexity, Gemini, and Google AI Overviews. A BrightEdge AI Catalyst analysis published in April 2026 found that pairwise top-100 overlap in named brands across five AI engines falls between 36% and 55%, a 19-point spread. Single-engine measurement captures only part of the picture.
- Repeat runs to account for variance. Run each prompt multiple times because AI outputs are probabilistic and vary across sessions. A 2026 study by researcher Dmitrij Zatuchin found that a single AI answer carries almost no brand-discriminating signal, with reliability near 0.01, and that reliability past the fifth repeat of a prompt improves by only 0.0003.
- Calculate mention rate and citation rate. Mention rate is the percentage of prompts where your brand appears in answer text. Citation rate is the percentage where your domain is linked as a source.
- Layer qualitative metrics. Track recommendation rate, top-recommendation rate, competitor displacement, sentiment, prompt coverage, and source share. These metrics explain how the brand appears, not just whether it appears.
- Read the competitor x topic matrix. Map competitors against topic clusters to see who is winning each cluster. Treat this matrix as the diagnostic centerpiece.
- Attribute the gap to sources. Identify which third-party sources carry the competitor’s narrative and why those sources are being cited instead of yours.
- Convert the diagnosis into a content plan. Produce comparison and recommendation content against the clusters where you are losing. Align each asset to the prompts and sources that drive the gap.
- Re-measure to confirm progress. Re-run the prompt set and track movement in mention rate, citation rate, and competitor displacement. Use the change to refine the next content cycle.
Build The Prompt Universe By Intent Cluster
A flat prompt list hides gaps, while intent clusters reveal where a competitor is winning and why. The eight clusters below cover the full range of buyer behavior in AI search.
- Category: Prompts that define the product category. Example: “What are the best project management tools?”
- Problem: Prompts that describe a pain point. Example: “How do I reduce onboarding time for new SaaS users?”
- Comparison: Prompts that compare options. Example: “Asana vs Monday for remote teams.”
- Use case: Prompts tied to a specific scenario. Example: “Best CRM for a 20-person sales team.”
- Commercial: Prompts with buying intent. Example: “Project management software pricing.”
- Recommendation: Prompts asking for a recommendation. Example: “What tool should I use for team collaboration?”
- Competitor: Prompts naming a competitor. Example: “Alternatives to ClickUp.”
- Brand: Prompts naming your brand. Example: “Is [Your Brand] good?”
Refresh the universe weekly because AI answers and competitor content shift quickly. Treat a universe of a few hundred queries as a starting point, not a ceiling. Tie the size to your market: a niche B2B category may need fewer prompts than a broad consumer category. Brantial’s measurement guidance notes that in a ten-prompt set, one changed brand mention moves the visibility result by ten percentage points, while in a 150-prompt set it represents about 0.7 points, which shows how prompt count shapes statistical reliability.
The Metric Stack Beyond Mentions
Mention count alone cannot show whether AI cites you as the answer or simply lists you. The table below maps each metric to the decision it supports.
| Metric | What It Measures | Decision It Informs |
|---|---|---|
| Mention Rate | Percentage of prompts where your brand appears in answer text | Whether you are visible at all |
| Citation Rate | Percentage of prompts where your domain is linked as a source | Whether AI trusts your content |
| Recommendation Rate | Percentage of prompts where AI actively recommends you | Whether you are preferred, not just present |
| Top-Recommendation Rate | Percentage of prompts where you are the first recommendation | Whether you are the default answer |
| Competitor Displacement | How often competitors appear where you should be recommended | Where to focus content investment |
| Sentiment | How AI describes your brand (positive, neutral, negative) | Whether you have a reputation problem |
| Prompt Coverage | Percentage of your target prompt set where you appear | Where you have zero presence |
| Source Share | Which third-party sources carry your narrative versus competitors | Which sources to influence |
Competitor displacement and source share most directly shape the content plan. Shadow’s AI SOV methodology distinguishes citation and absorption as two discrete stages, meaning a brand can be cited in footnotes while contributing nothing to the actual answer. Tracking both layers shows whether your content shapes the response or only appears in a footnote.
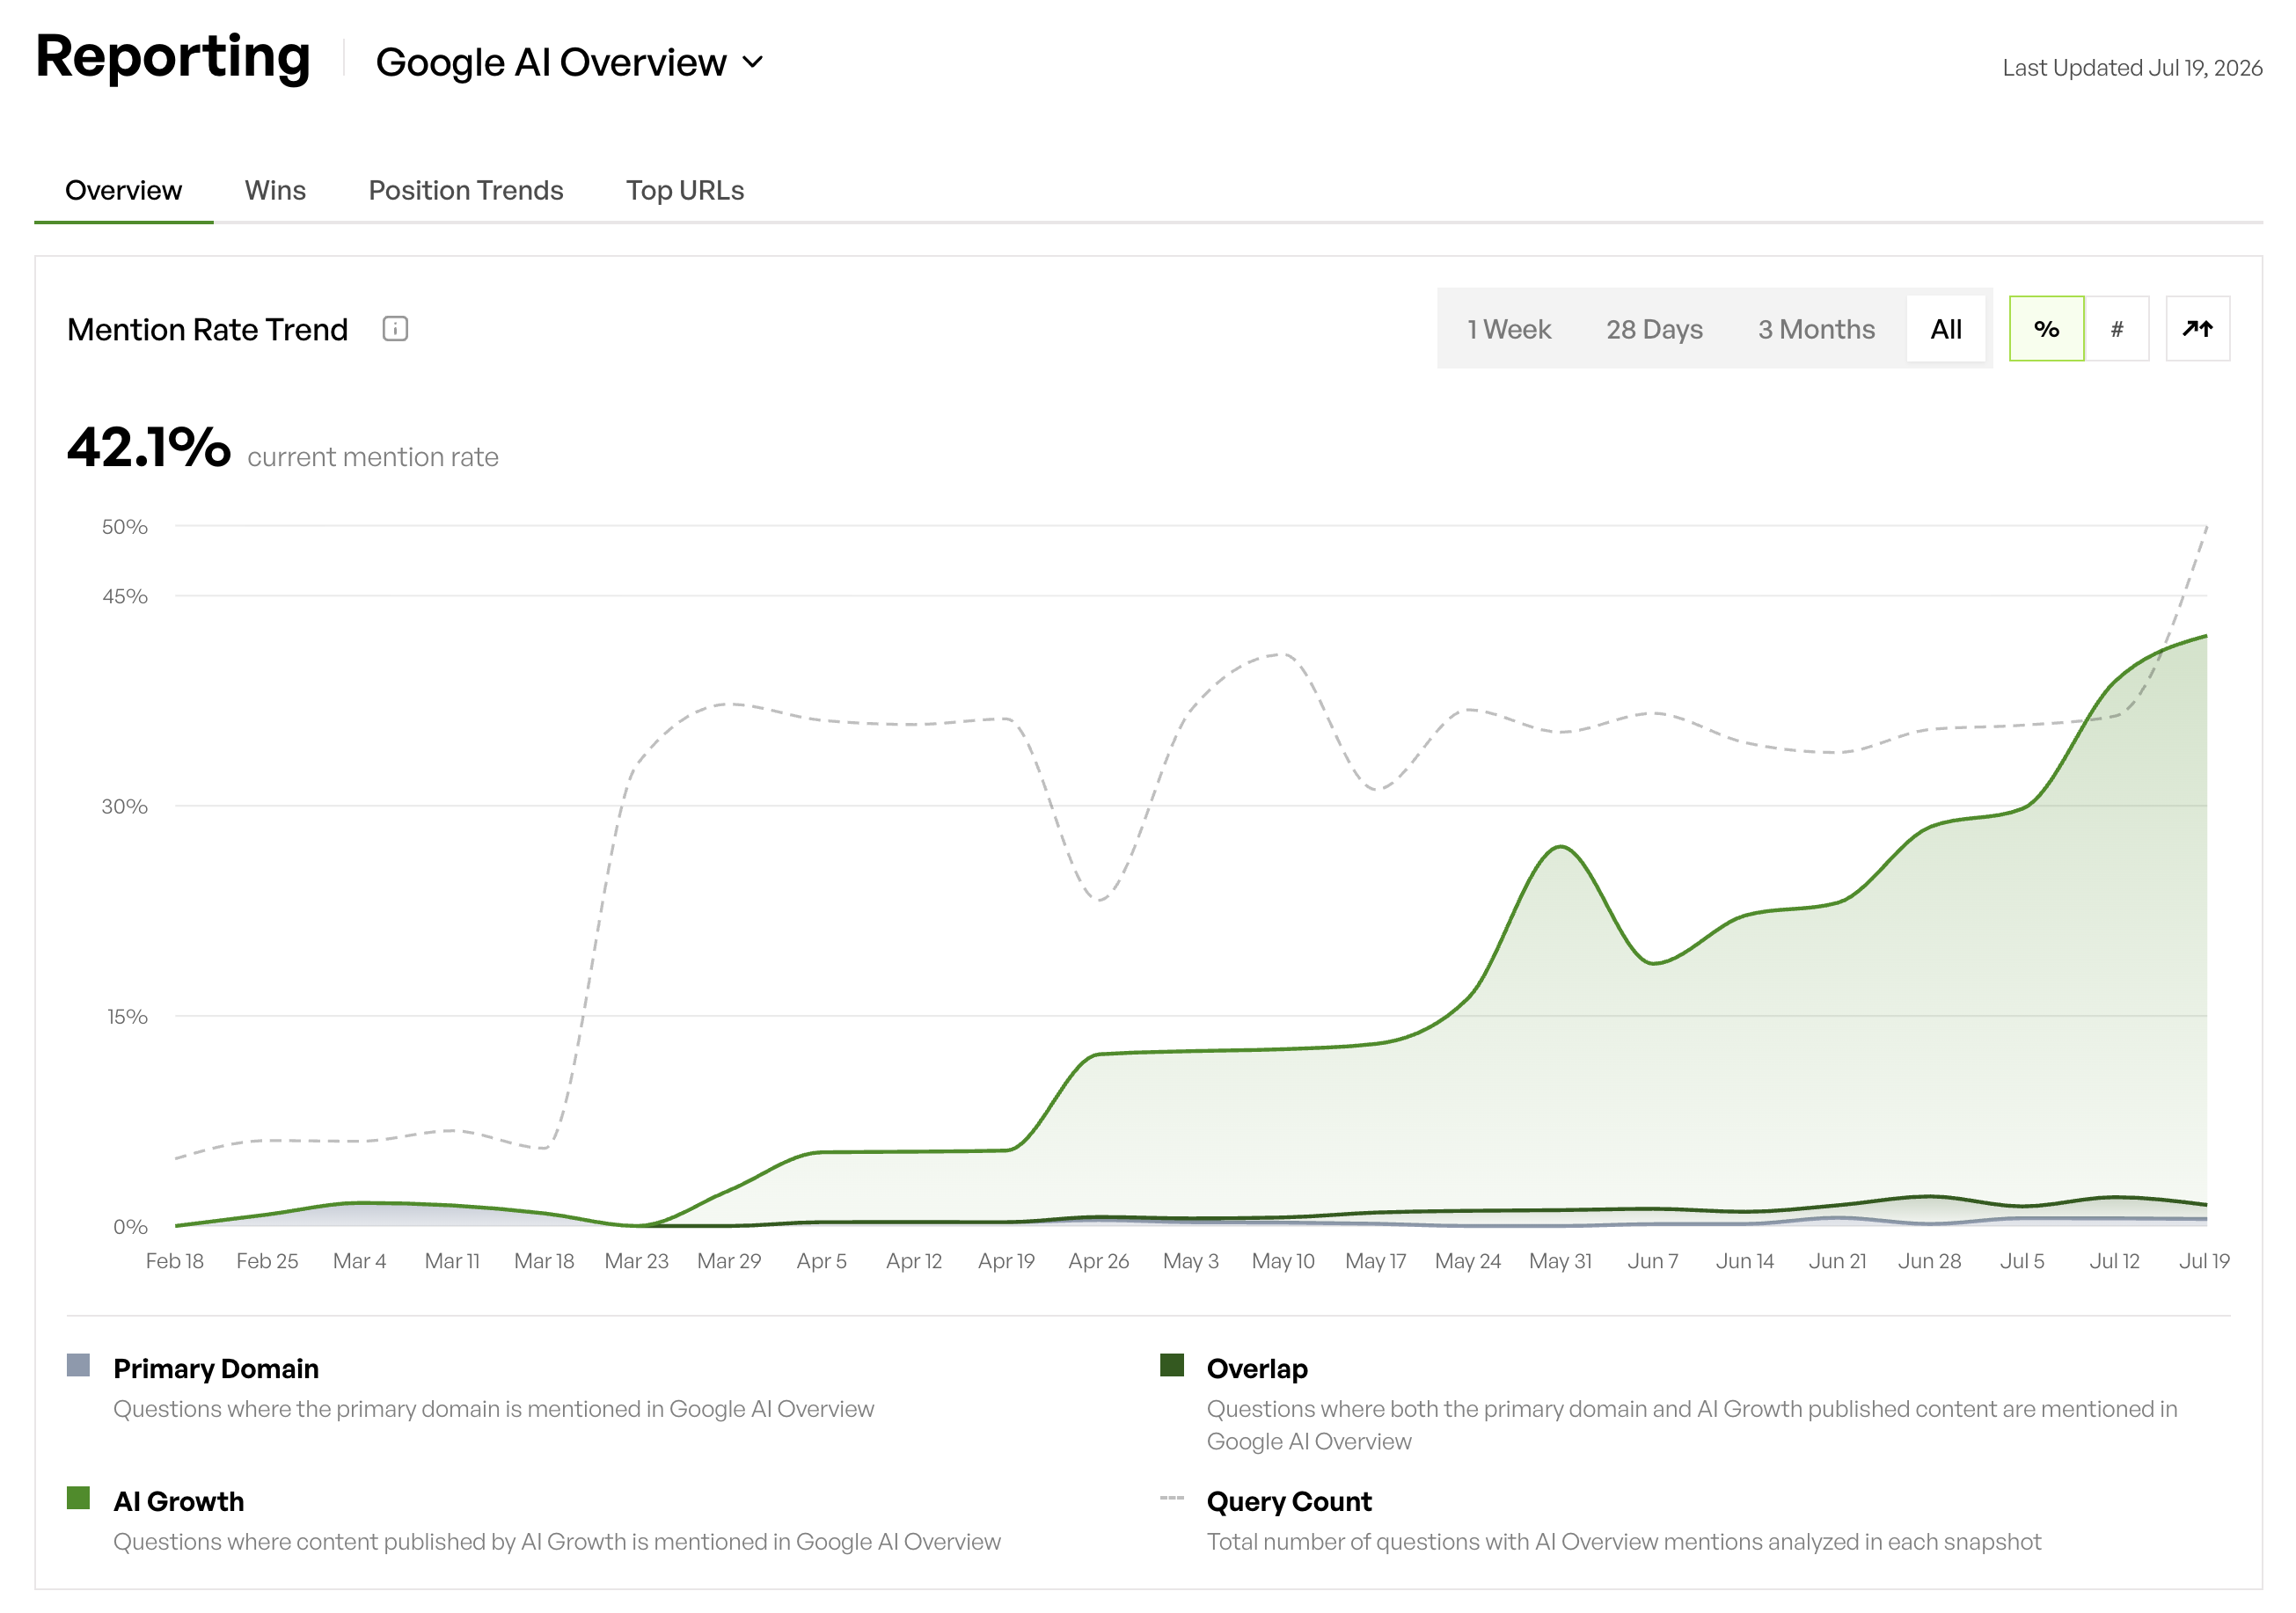
With these metrics in hand, the next step is to apply them to a structured diagnostic: the competitor x topic matrix.
The Competitor X Topic Matrix
The competitor x topic matrix gives a clear view of who wins each cluster. Build a matrix with competitors on one axis and topic or intent clusters on the other. Each cell shows the brand that wins the prompts in that cluster.
To see how this works in practice, consider a scenario where a competitor wins the comparison and recommendation clusters while your brand wins only the brand cluster. This pattern signals that the competitor appears as the default answer in high-intent prompts. The brand cluster is already in your column. The comparison and recommendation clusters are where the gap lives.
Based on this diagnosis, the content decision is to produce comparison and recommendation content against those clusters, backed by validated primary sources. Profound’s AEO playbook documents a case where Ramp published two listicle pages targeting unbranded category-level prompts and generated over 300 citations within one month, and those pages became some of Ramp’s most-cited content. The specificity of the “for Y” qualifier matters. “Best CRM software” competes with thousands of pages, while “Best CRM for SaaS companies that need pipeline reporting” can own its prompt entirely.
See AI Growth Agent’s Competitor Matrix In Action
Source Attribution: Tracing Why A Competitor Surfaces
Source attribution explains which external sites push a competitor into AI answers. AI systems lean heavily on sources such as Reddit threads, YouTube videos, Wikipedia, review sites, and press coverage. Source share shows which of those sources carry the competitor’s narrative.
Source Attribution Method
- Identify the cited sources behind the competitor’s winning prompts.
- Classify them by type: UGC, review platform, press, comparison page, or owned content.
- Decide which ones you can realistically influence with owned content, earned coverage, or community participation.
A March 2026 analysis by Peec AI of 30 million sources cited in AI-generated answers found Reddit was the most-cited domain overall, followed by YouTube and LinkedIn. A separate February 2026 analysis by Kevin Indig for G2, based on roughly 35,000 citation URLs from ChatGPT, found that UGC platforms hold 17.1% of cited domains for SaaS-related prompts, more than 4x the 4.0% held by publishers.
The practical implication is that a competitor winning comparison and recommendation prompts almost always does so through third-party coverage in addition to its own domain. BrightEdge AI Catalyst found that pairwise top-100 overlap in cited sources across engines ranges from 16% to 59%, a 43-point spread, which shows that source selection varies far more than brand naming. Identifying which sources drive the competitor’s citations tells you exactly where to invest in earned coverage.
Cross-Engine Variance: Turning Disagreement Into Priority
Cross-engine variance reveals where to focus first. ChatGPT, Perplexity, Gemini, and Google AI Overviews only partially agree on which brand to recommend. As noted earlier, BrightEdge AI Catalyst found a 19-point spread in brand overlap across engines. Treat cross-engine disagreement as a primary finding that drives prioritization.
Each engine operates differently at the source layer:
- Perplexity names brands earliest of any engine, with 86% of its brand mentions landing in position 5 or earlier. It rewards fresh primary sources and concentrates citations in institutional, medical, and government sources.
- ChatGPT leans on trained associations plus its own search index, with the flattest source distribution of any engine, where its top 10 most-cited domains account for only 18.5% of total citations.
- Google AI Overviews still weights classic ranking signals and is the only engine where UGC citations outweigh authoritative citations, with approximately 17.5% of its citations coming from user-generated content platforms, 35x higher than ChatGPT’s 0.5%.
- Gemini functions as a formal institutional recommender, with approximately 26% of its citations coming from government, academic, and major institutional sources combined, and only 0.2% from UGC.
When a brand wins on ChatGPT but loses on Perplexity, prioritize the engine where your buyers actually ask questions for your first content investment. The engine where the competitor is strongest gets the second investment. Layer3Labs’ 2026 AI search visibility guide notes that AI visibility tactics do not transfer across engines: Perplexity rewards fresh primary sources, ChatGPT leans on trained associations plus its own search index, and Google AI Overviews still weights classic ranking signals.
From Gap To Action: Turning Diagnosis Into A Content Plan
A diagnosis only creates value when it becomes content that closes the gap. Use this four-step conversion path.
- Identify the clusters where competitor displacement is highest in the matrix.
- Attribute the displacement to specific third-party sources using source share data.
- Produce comparison and recommendation content targeting those clusters, with every claim validated against primary sources.
- Re-run the prompt set after four to six weeks to measure movement in mention rate, citation rate, and competitor displacement.
Treat this as a continuous loop, not a one-time audit. Some practitioners argue that continuous, daily tracking is needed because AI answers change constantly as models update and web content shifts, though many sources recommend weekly or monthly measurement cadences as sufficient. A single snapshot misrepresents true standing and misses real volatility. The content plan runs as a repeating cycle: measure, diagnose, produce, re-measure.
AI Growth Agent fits into this cycle as the execution engine. It maps a broad universe of seed terms and long-tail queries from real-time Google and ChatGPT data, produces authoritative content against each gap with every claim and source validated, publishes to a site the client owns, and keeps that content current so the gap stays closed. Monitoring-first tools meter prompts and hand the work back to a human. Manual workflows with a chatbot create one decent article and then stall. AI Growth Agent closes the loop by handling mapping, production, publishing, and ongoing updates in one system.
Across the first twelve weeks, clients average more than 12,000 additional AI citations and mentions, over 100,000 additional bot visits, and a 20%+ lift in impressions. Breadless, a healthy fast-casual franchise, reached an 84% citation rate against competitors and a 72% recommendation rate versus Sweetgreen’s 13% within 90 days. Leva Sleep became the most mentioned retailer for adjustable beds in Canada, with ChatGPT citing Leva Sleep content over 10,000 times per month.
Talk With AI Growth Agent About Your AI Visibility
Frequently Asked Questions About AI Share Of Voice
What Is A Good AI Share Of Voice Percentage?
A strong AI share of voice percentage depends on category, prompt intent, competitor set, and sample size. A 15% share may lead a fragmented category but trail in a category dominated by two players. Compare against your own baseline and the category leader. In niche B2B categories with three to five competitors, leaders typically hold 40% to 60% share. In mid-market B2B categories with ten to twenty competitors, leaders typically hold 20% to 35%. The number that matters most is the delta between your share and the category leader’s share on the specific clusters where you are losing.
What Is The Difference Between Share Of Voice And Share Of Market?
Share of voice measures visibility across a channel in impressions, mentions, rankings, or citations. Share of market measures actual revenue or units sold. Share of voice typically leads share of market by months, not weeks. A brand with share of voice above its share of market tends to grow because it is over-investing in visibility relative to its current size. A brand with share of voice below its share of market tends to shrink. The AI share of voice competitive analysis in this guide measures the visibility layer, which acts as the leading indicator ahead of revenue.
Which AI Tool Is Best For Competitive Analysis?
The right AI tool depends on your goal. Monitoring-first tools track brand appearance for a metered set of prompts and hand the diagnosis back to you as a to-do list. AI Growth Agent maps a broad universe, produces authoritative content against each gap, publishes to a site you own, and maintains that content over time. The distinction is architecture. Monitoring tools function as a rearview mirror, while AI Growth Agent acts as the steering wheel. Choose based on whether you need a dashboard or a closed loop that maps, produces, and maintains content without requiring a large content team.
How Often Should I Re-Run The Analysis?
Re-run the analysis on a predictable cadence. Run weekly spot-checks on your top 10 to 15 priority prompts across two to three engines. Run a monthly full audit across your complete prompt library. Conduct quarterly strategic reviews to assess trends and refresh the prompt set. The quarterly review is also when you should expand the prompt universe, add new competitors that have surfaced in your data, and re-examine which clusters drive the most competitor displacement. AI citation distributions shift within weeks due to model parameter updates, retrieval index refreshes, and competitor content changes, so a quarterly-only cadence misses meaningful movement.
How Do I Prove The Gap Closed?
Prove progress by re-running the same prompt set across the same engines and tracking movement in mention rate, citation rate, and competitor displacement. Isolate the visibility your new content generated separate from visibility you already had. AI Growth Agent publishes into a separate environment and reports incremental visibility, which isolates exactly what it generated week over week. In a zero-click world, no single tool can fully attribute an AI recommendation to a sale, so the clients who measure best capture source at the conversion moment by adding an explicit AI option to demo and signup flows. They consistently see a lift in organic leads after starting, alongside measurable movement in mention rate and citation rate on the specific prompt clusters they targeted.
Conclusion: Turning AI Visibility Into A Repeatable Growth Loop
Tracking AI share of voice shows where you stand, and diagnosing it explains why a competitor is winning and what closes the gap. The method stays consistent: build a defensible prompt universe, read a competitor x topic matrix, attribute the gap to sources, and convert the diagnosis into a content plan.
The brands that win AI share of voice in 2026 convert the diagnosis into content fast enough to close the gap before the next model update reshuffles the leaderboard. AI Growth Agent acts as the engine that maps the universe, produces authoritative content against each gap, and keeps that content current so the gap stays closed.
For more on measuring and benchmarking AI visibility, see AI Share of Voice Benchmarks: What Good Looks Like, How to Perform AI Share of Voice Analysis in 2026, and Competitor AI Share of Voice: Track and Beat Rivals.
Get A Custom AI Share Of Voice Plan